When will U.S. house prices peak before the next crisis?
Compare versions Back to question
-
Study the background information carefully.
-
Read the background information carefully, before proceeding.
Wiki article
EditBackground
From the perspective of the Austrian School of Economics, most measures after the financial crisis 2007/08 were more populist activism and badly deliberated gut-rections of politicians which lacked insight into - not to mention solutions for - its true causes which are essentially a dysfunctional system of tax incentives for debt making and well-intended but ill-advised government debt promotion schemes e.g. for sub-prime credit, leading to reckless borrowing and artificial asset price rises.
Case-Shiller Index
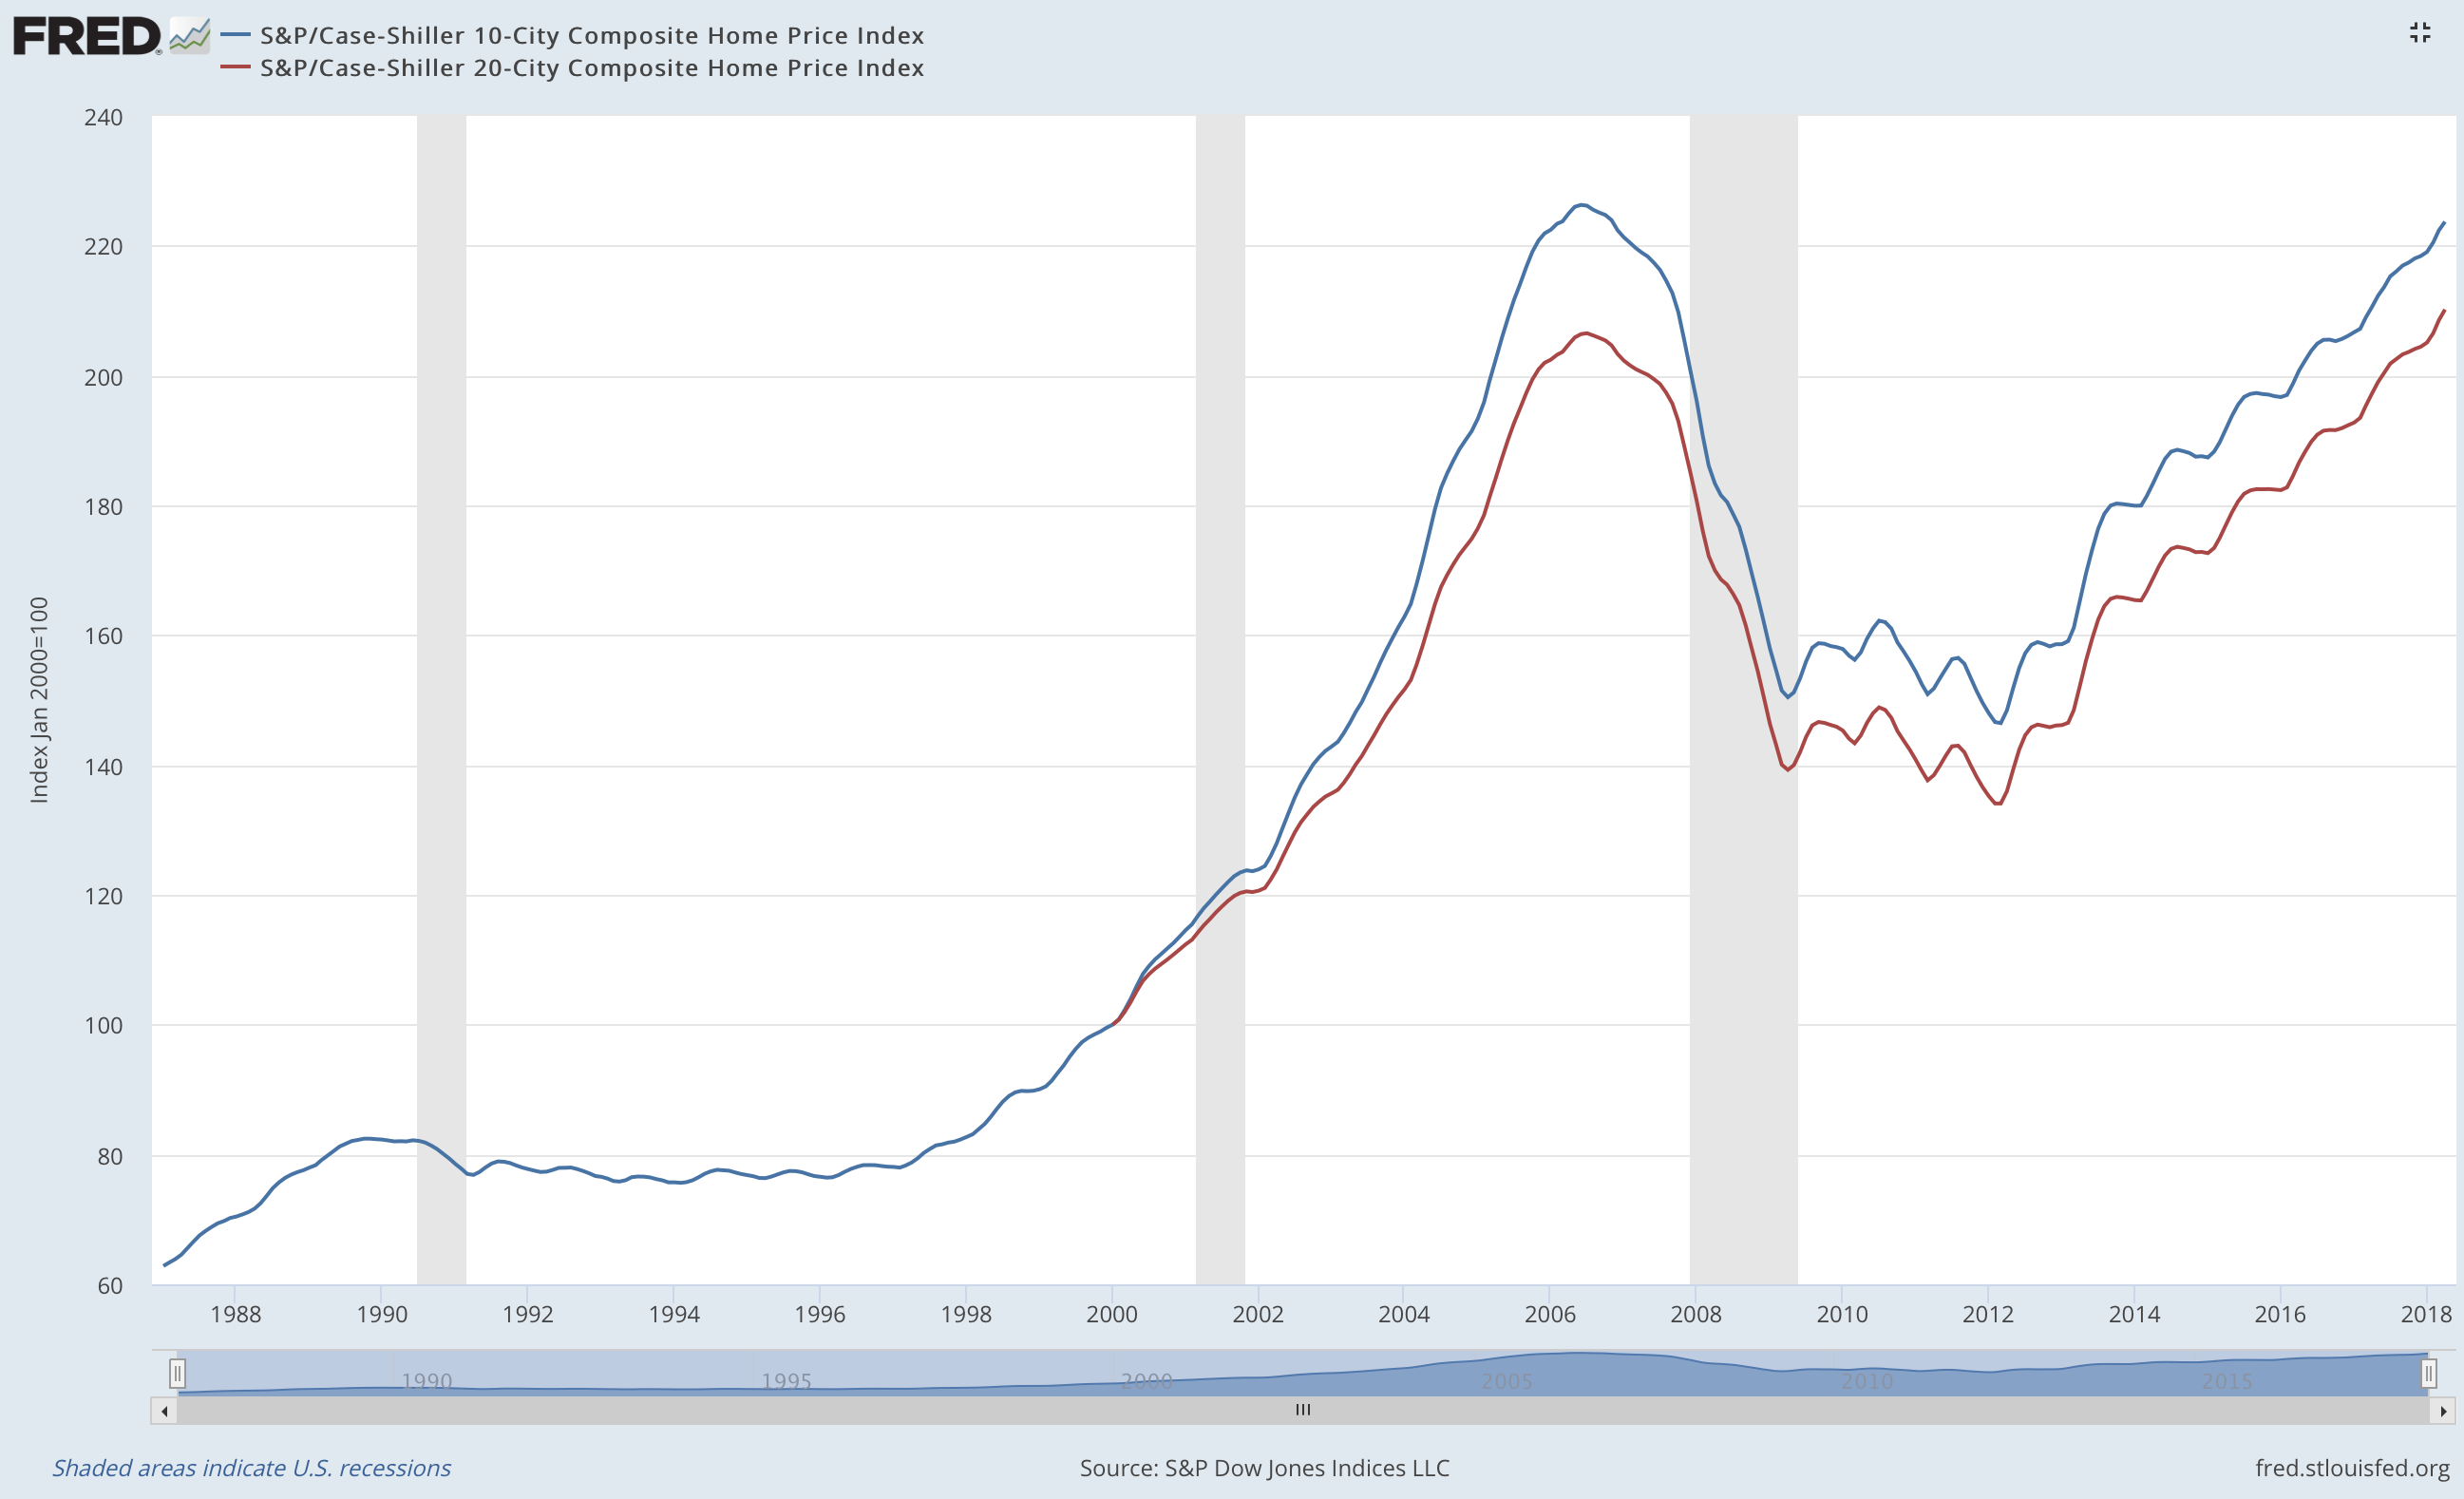
Recently, a key leading indicator of the last crisis, the Case-Schiller Index, reached again the level of 2007 which signals danger. In simple language, the index shows how much the builder of a new house stands to make in the secondary house market. An index of 200 point effectively is a license to double your money. Question is: How long can such a systemic flaw last? What level can this disproportionate profit opportunity reach?
Here is also a link to a chart with the current index values.
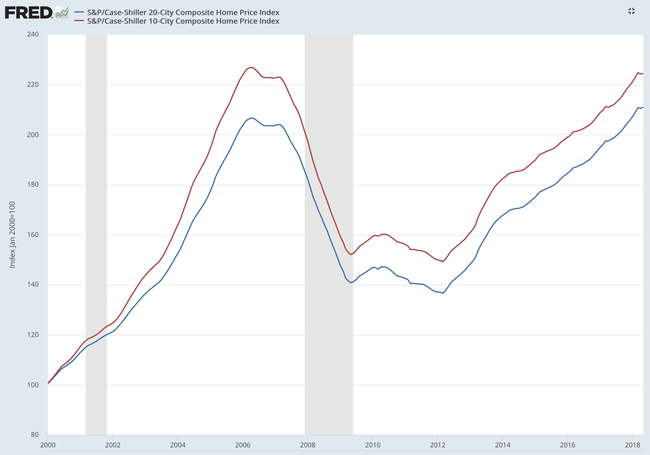
July 2018 vs. November 2018
The left chart below shows the index value as of July 2018, still rising, and just reaching the 2006 hights.The next chart for November 2018 shows how the index now hovers at these same peak levels. History has just started to repeat itself.
 |
 |